Positive Cases
Confidence Interval

The 90% confidence interval (CI) represents uncertainty in the % positive estimate. For a given estimate, the CI will narrow as the number of samples increases and widen as the number of samples decreases.

Find out more
Total Tested

    Parasite Infection Maps

    ESCCAP’s interactive maps show the percentage of screened pets testing positive for parasites and parasite-associated infections in different geographical areas.

    The maps are populated with data from a range of targeted diagnostic tests and include results from travelled or imported pets, regardless of their origin.

    Click on a country or region for further details.

    For more detailed information, please refer to ESCCAP’s guidelines, modular guide series and fact sheets.

    Guidelines

    Guidelines

    See our guidelines for geographical occurrence in Europe, along with distribution maps for certain parasites and parasite-associated infections.

    These maps depict the percentage of positive tests in screened pets, NOT the overall prevalence of infection.

    Pets may be tested for a variety of reasons including wellness checks, surveillance or clinical illness and may not be representative of the population as a whole.

    Map interpretation

    Results can be influenced by a number of factors as detailed below:

    Population Representation

    Population Representation

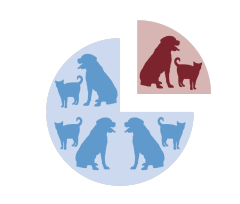
    Sample size directly influences map accuracy.  Percentages calculated from insufficient sample sizes risk generating spurious hotspots due to over-representation.

    Background

    Background

    Pet history, especially for rescue and imported animals, can influence results.  Prior infection or exposure outside the map area may not be reflected in the visualised data.

    Sampling Bias

    Sampling Bias

    Diagnostic assay results are more likely to be requested for higher-risk animals (clinically ill, prior infections, lifestyle/location risks) due to veterinary test ordering practices. This can lead to inflated positive test rates.

    Epidemiological Mapping of Veterinary Data

    Epidemiological Mapping of Veterinary Data

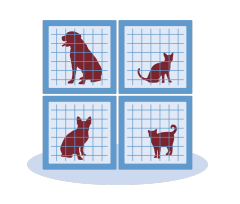
    Epidemiological studies use a study population to represent a target population.  These maps only reflect test results from owned animals seen at veterinary clinics, not the broader animal population which would typically include untreated, stray, feral or unpresented animals.  Maps based solely on veterinary clinic data may not therefore accurately represent the broader animal population.

    Seasonality

    Seasonality

    The data presented is potentially unrepresentative of the full year.  This is because testing can be seasonal and data output entirely depends upon how many tests were carried out in the areas depicted during a given time period.

    Sensitivity & Specificity

    Sensitivity & Specificity

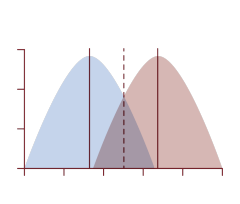
    Diagnostic test performance is evaluated by its sensitivity and specificity and variations in these metrics can significantly affect results.  Sensitivity measures how well a test correctly detects an infection and a highly sensitive test minimises false negatives.  Specificity measures how well a test correctly identifies animals that do not have an infection (true negatives) and a highly specific test minimises false positives.

    Test Type

    Test Type

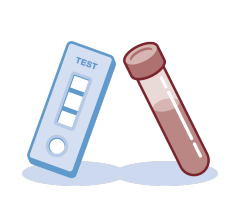
    Antigen and antibody diagnostic tests differ fundamentally, and understanding the difference between the two is very important when interpreting these maps.  Antigen tests identify the presence of the antigen itself, indicating an active infection.  Antibody tests detect the presence of antibodies, which typically indicates a past infection or prior exposure, although in some cases, antibodies can be detectable during the acute phase of an infection.  For certain infections, both types of tests are used and the maps do not differentiate between test types, therefore the data must be interpreted accordingly, considering the limitations and implications of each test type.


    Percentage Bar Example

    The percentage bars show the observed test result percentage and a 90% confidence interval calculated using the exact method (Clopper‑Pearson). The 90% confidence intervals (CI) represent uncertainty in the % positive estimate.  By definition, 90% of CIs will contain the true value of the % positive parameter they represent.  For a given estimate, the CI will narrow as the number of samples increases and widen as the number of samples decreases.


    24.79%
    Confidence interval: 24.23% to 25.35%% Positive: 24.79%

    Feedback?   Help us improve our maps

      required
    x